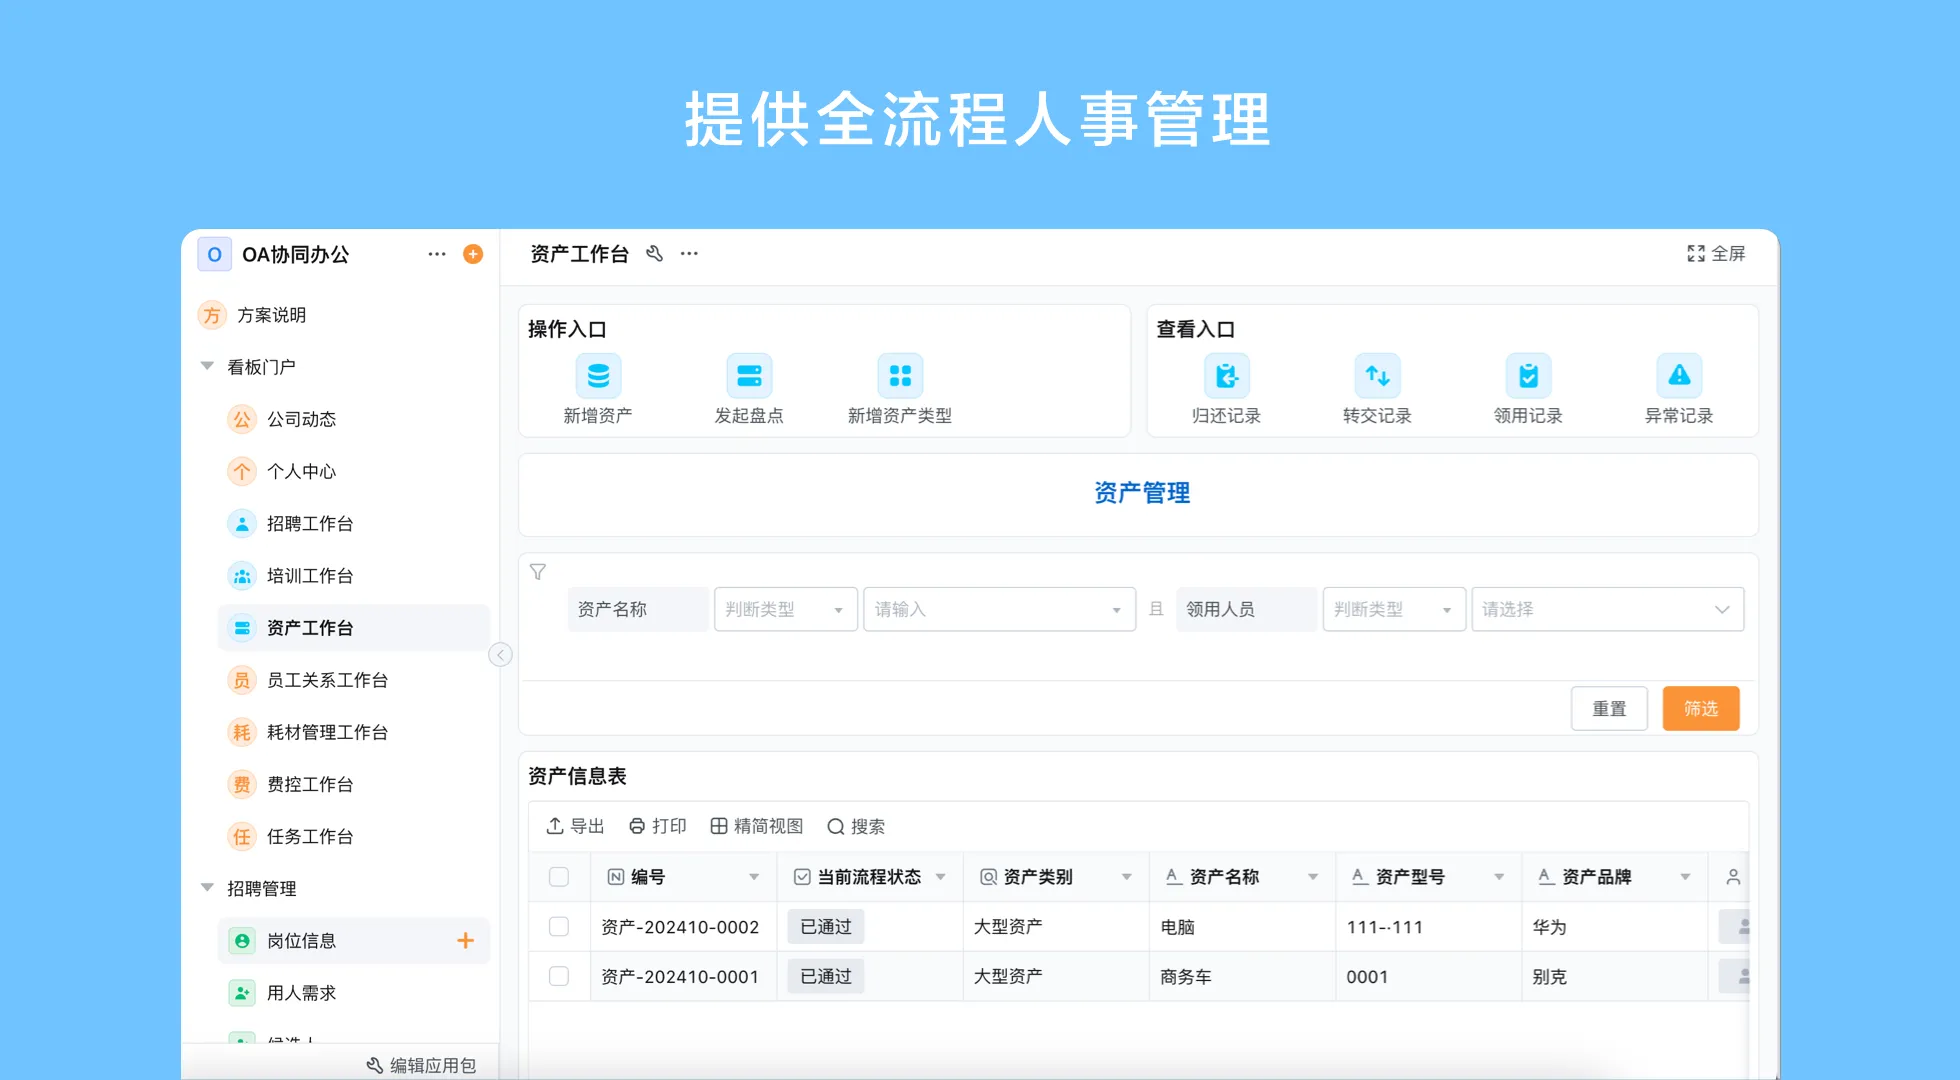
What an ERP dashboard should answer
An ERP dashboard presents a focused summary of data from business processes such as purchasing, inventory, orders, production, or finance. The strongest dashboards help a specific user answer a practical question: Which orders need attention? Where is stock below the agreed threshold? Which approvals are waiting? A dashboard is less useful when it shows many metrics without context, definitions, or a path to the underlying record.
Separate operational monitoring from management analysis. A buyer may need a work queue of open purchase requests, while an operations leader may review trends in supplier delivery or inventory exceptions. Finance may need reconciled transaction totals and period status. Combining all of these into a single screen can hide the details each person needs.
Choose KPIs by decision and owner
For each proposed KPI, write down its definition, source, calculation, update cadence, owner, and intended action. This prevents two teams from using the same label for different measures. For example, “inventory value” may depend on valuation rules and included locations; it should not be treated as self-explanatory. If the source records are incomplete, display the data-quality limitation alongside the metric.
- Label the reporting period and update time.
- Show the responsible team or process owner.
- Give the user a path to inspect the records behind a flagged value.
- Keep sensitive detail limited to the roles that need it.
| Business area | Example KPI | Definition to agree | Possible follow-up |
|---|---|---|---|
| Inventory | Items below reorder point | Count of active items whose available quantity is under the approved threshold, by location. | Review demand, open orders, and replenishment ownership. |
| Purchasing | Open purchase requests | Requests submitted and not yet closed, separated by approval or buyer status. | Identify the current blocker and assigned owner. |
| Order handling | Orders awaiting fulfillment | Orders accepted but not marked fulfilled under the organization’s process definition. | Check stock, production status, or shipping handoff. |
| Manufacturing | Work orders with an exception | Released work orders with a recorded shortage, quality issue, or other unresolved exception. | Assign a resolution owner and review priority. |
| Finance | Unreconciled transactions | Transactions awaiting the defined review or reconciliation step for a stated period. | Route to the responsible reviewer; verify against the finance system. |
Design a manufacturing ERP dashboard around action
Manufacturing ERP dashboard KPIs should reflect the company’s production model and the records it can reliably maintain. Useful candidates may include work orders by status, orders blocked by material readiness, recorded inspection exceptions, or completed quantities compared with the plan for a defined period. These measures are not universal standards. Define what “released,” “blocked,” and “complete” mean before comparing teams or periods.
Distinguish leading signals from results
A leading signal can flag a potential issue before a final outcome is known, such as a work order waiting for material confirmation. A result measure describes what has already occurred, such as completed work orders during a period. Showing both can help a manager respond earlier, but only if the status transitions are used consistently. If teams update records at different times, a chart may describe data-entry behavior instead of actual operations.
Should you use a real-time ERP dashboard?
A real-time ERP dashboard is valuable only when the source systems, integrations, and refresh behavior support the required cadence. The phrase “real time” can mean immediate updates, frequent synchronization, or simply a view that refreshes when opened. Ask how data is collected, how stale records are identified, and whether the dashboard is operationally suitable for time-sensitive decisions. If the underlying process updates once per shift, a second-by-second chart can create false precision.
For a dashboard connected to more than one system, clarify latency and conflicts. Decide which system owns a field, how duplicate records are resolved, what happens when a connection fails, and who checks the reconciliation. Display a last-updated timestamp or data-period label when the view could otherwise be mistaken for a live status.
Build an ERP reporting dashboard for inventory and finance
An ERP reporting dashboard for inventory and finance should preserve the distinct meaning of operational stock records and financial valuation. Inventory teams may track on-hand quantity, allocated quantity, receipts, transfers, and adjustments. Finance may rely on a chart of accounts, valuation method, posting period, and reconciliation rules. A combined view can support coordination, but it should not imply that operational records have been formally posted or reconciled unless that is true.
- Choose the audience. Decide whether the view is for a buyer, warehouse lead, finance reviewer, or executive.
- Write metric definitions. Include the unit, time window, excluded statuses, and source of each calculation.
- Check the records. Review duplicates, missing locations, stale statuses, and unassigned transactions.
- Match chart to question. Use a trend for change over time, a table for item-level follow-up, and a status summary for workload.
- Link to the next action. Give users a clear route to the record, owner, or review step behind a concerning measure.
- Review use. Ask whether the dashboard changes a decision; remove measures that no one uses or can explain.
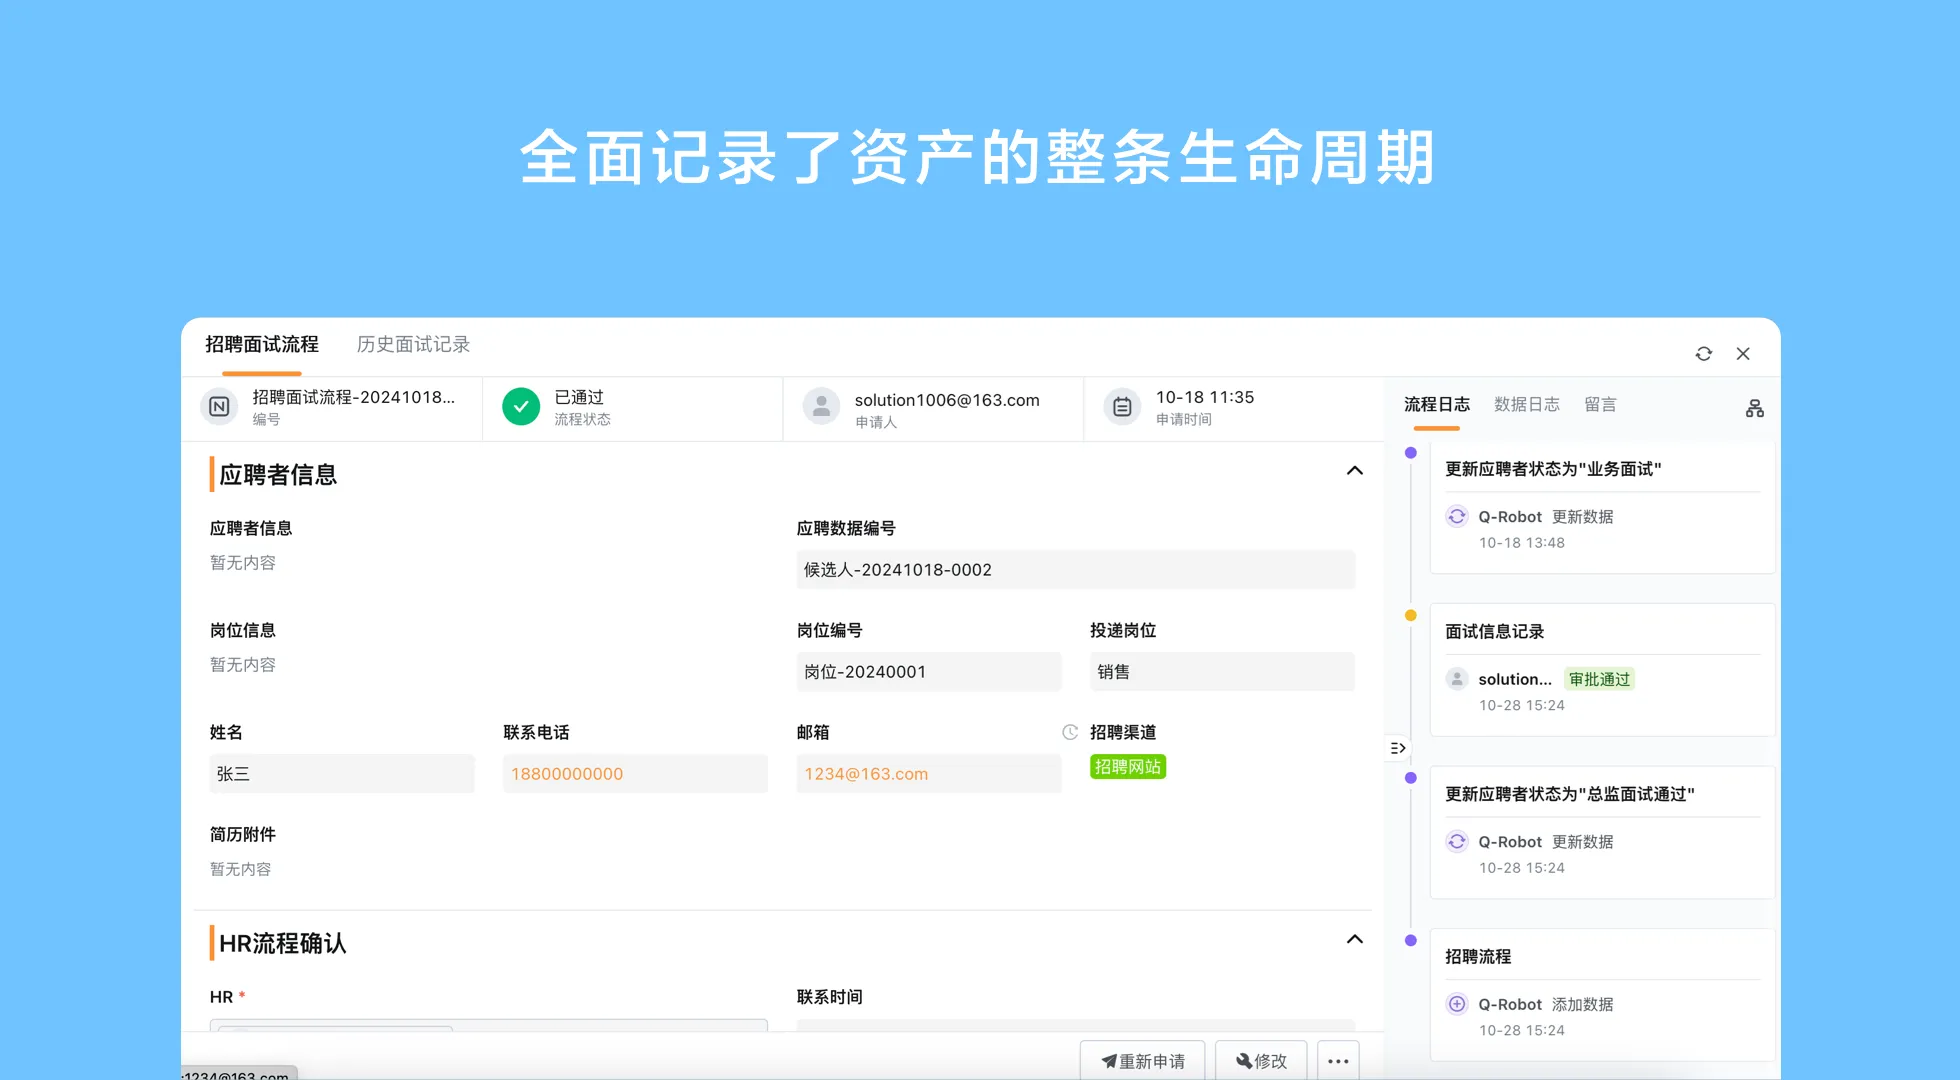
Governance keeps dashboard numbers credible
Assign an owner to every important metric and establish a change process. When a definition changes, document the effective date so users understand why a trend shifted. Restrict access to sensitive records based on role, and test whether aggregated views reveal information that users should not see. Avoid mixing manually entered targets with system-generated actuals without labeling the difference.
Qingflow provides configurable reports and dashboards based on application data as part of a wider no-code business platform. A team may configure views for workflow or operational records, while confirming the specific data source and refresh behavior for its implementation. Qingflow should not be described as supplying a real-time ERP dashboard for every connected system without verifying the relevant integration and update cadence.
Conclusion
An effective ERP dashboard is a decision aid built on trusted definitions. Choose the audience and action first, use a small set of meaningful KPIs, and make data freshness and ownership clear. For inventory, finance, and manufacturing, keep the underlying business meanings distinct even when their records appear together. Review dashboards as processes change so the view remains useful and credible.
If your team needs configurable operational views connected to its forms and workflows, explore Qingflow. Confirm the source data, permissions, report behavior, and update cadence for your use case before treating a dashboard as an operational or financial system of record.
Frequently Asked Questions
Q1: What belongs on an ERP dashboard?
A: Include only the measures needed by the dashboard’s audience to make or monitor a decision. Common examples include open approvals, inventory exceptions, order status, work-order blockers, and defined financial review items. Each KPI should have a source, owner, calculation, period, and action. Avoid combining metrics with different definitions or displaying confidential detail to users who do not need it.
Q2: How do I choose manufacturing ERP dashboard KPIs?
A: Start from a production or coordination decision, then identify records that consistently represent its status. Measures may include work orders by state, material readiness exceptions, or recorded inspection issues. Define terms such as “released” and “complete,” select a reporting period, and validate the data with production users. Do not compare teams until recording practices and KPI definitions are consistent.
Q3: Does every ERP reporting dashboard for inventory and finance need real-time data?
A: No. The required cadence depends on the decision. A warehouse task may need a frequently refreshed status, while a period-based finance review may depend on reconciled data at a defined close point. Choose a cadence that the source systems can support and display when data was last updated. Confirm system ownership and reconciliation before using a combined view for financial decisions.
常见问题
本文由轻流知识中心编辑整理
轻流(Qingflow)是一体化 AI 无代码平台,持续围绕生产管理、进销存、设备巡检、 CRM、OA 等企业数字化场景输出实操内容,帮助团队更快完成系统选型、 流程优化与落地搭建。